Where the Council Got It Wrong
When North Yorkshire Council calculated their projected savings, they performed an incomplete, top-down paper exercise. They counted the theoretical money saved by taking bus passes away from rural children, but completely omitted the unavoidable new costs created by their own policy change.
1. County Border Blindspot
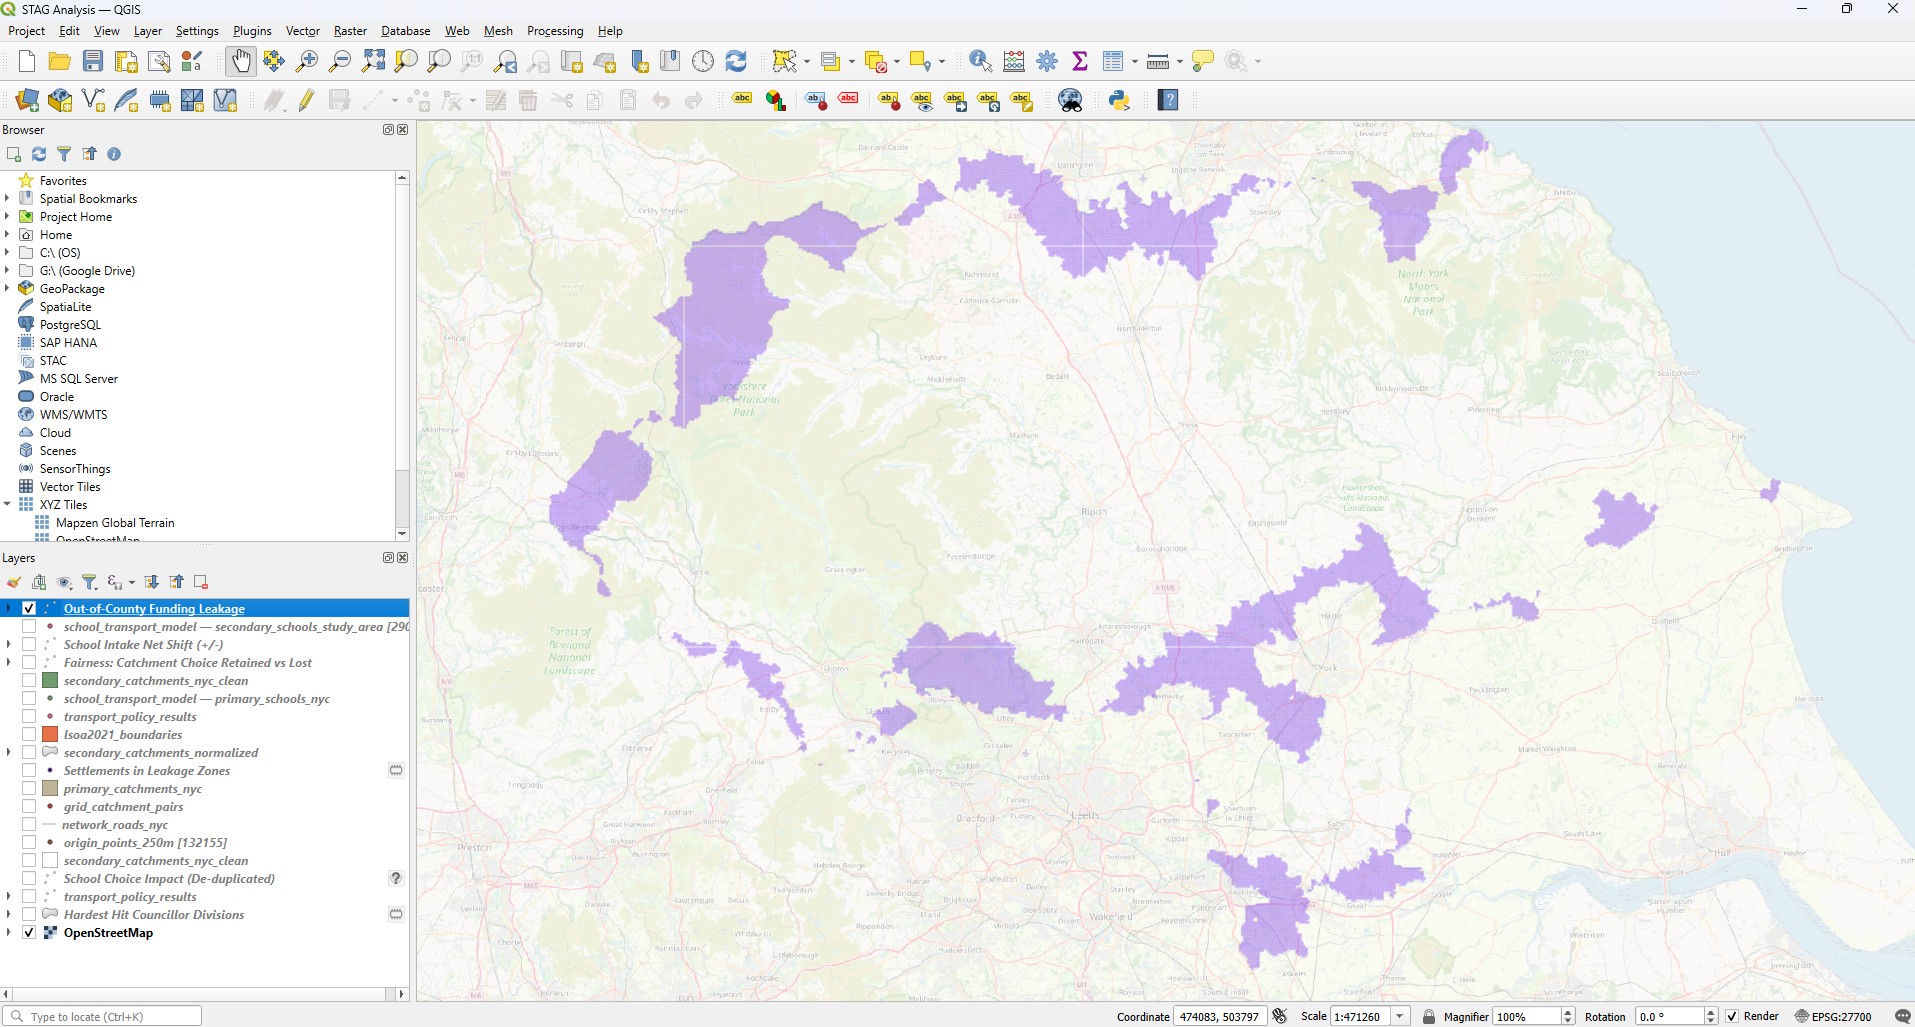
North Yorkshire has England's longest rural boundary. The council completely failed to consider families near borders (Lancashire, Cumbria, West Yorkshire, East Riding, Teesside). Under blunt "nearest school" rules, children are told their funded school is in an entirely different local authority—where admissions clash—or stripped of transport to their traditional community school.
2. Political & Electoral Blindness
Council leadership seemingly gave no thought to the electoral consequences for their own ward councillors at upcoming elections. Imposing unfair cuts on rural families has sparked fierce non-partisan anger across market towns and villages. Councillors are being forced to defend an unworkable policy on the doorsteps that harms rural voters.
3. Ignorance of Transport Economics
The policy demonstrates a fundamental misunderstanding of passenger transport logistics. High-capacity rural buses have fixed step-costs; removing some pupils doesn't reduce contract costs proportionally. Instead, stranding residual entitled children forces the Council into expensive private hire taxis (£150/day = ~£28.5k/year per vehicle), quickly wiping out theoretical savings.
Built by Parents — Analysis the Council Failed to Do
None of this analysis is overly complex or difficult. We are ordinary local parents volunteering our time—yet North Yorkshire Council, with all its paid officers, consultants, and public resources, could and should have carried out this basic due diligence before proposing sweeping cuts. Instead, the council failed to consider the real-world impacts and grossly miscalculated their theoretical savings. Their entire approach is fundamentally flawed.